Today marks the release of one of the biggest updates to Meteoweser. Version 5.0.0 introduces new features, an improved interface, and enhanced app stability.
Geomagnetic activity
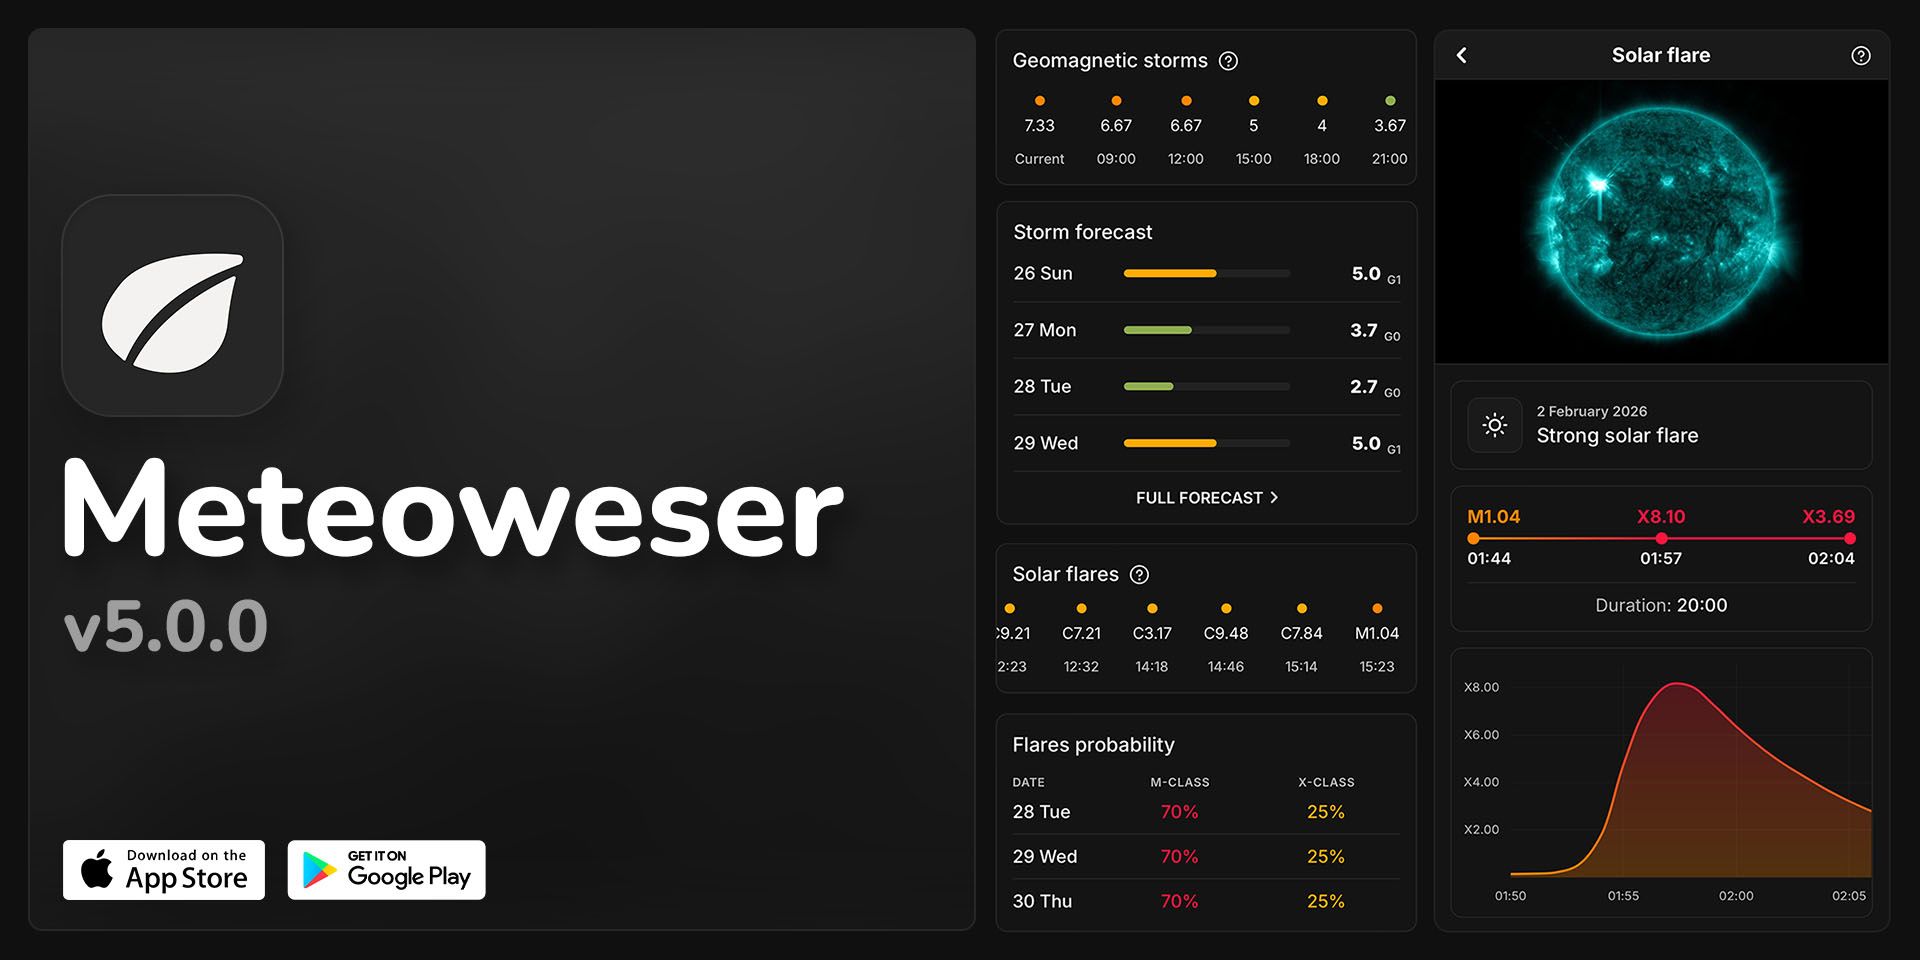
The geomagnetic activity forecast has been moved to the home screen. It now displays a brief summary for the next few days, and you can access the full forecast and history with a single tap.
The home screen now also displays more data from the hourly forecast and history.
Solar flares
Now, tapping on a flare opens a screen displaying a satellite image of the Sun at the moment of peak intensity, the duration of the flare, a chart of the X-ray flux, and the level of radio interference during the event. The amount of data available depends on the flare class.
In addition, the main screen now displays a forecast of the probability of M-class and X-class solar flares for the next three days, and the number of events shown in the general list has been increased.
Visualization & interface
A new chart system with dynamic color changes has been implemented. Now the color of the lines changes depending on the values of the indicators, allowing you to visually determine the level of activity.
The color indication system for the information tiles has also been expanded. From now on, they change color based on the values received for a greater number of parameters.
Bug fixes & improvements
Fixed the display of Bt, Bz, and solar wind parameters. Also resolved an issue with time display that occurred when there was a mismatch between the device’s time zone and the selected city.
Data storage and notification systems have also been improved.